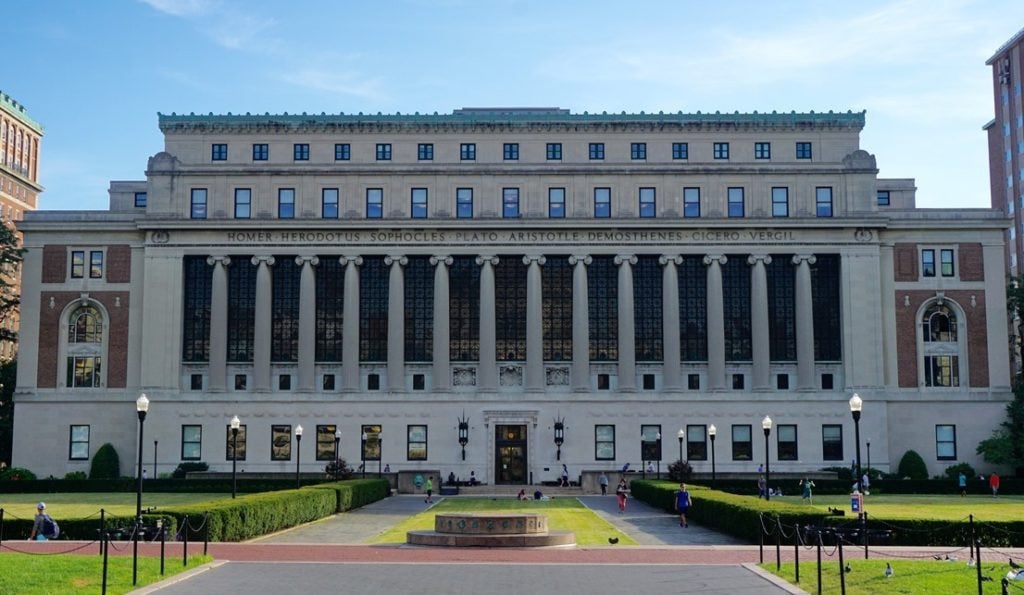
Columbia University remains one of the most selective and sought-after universities in the world. Every year, tens of thousands of students vie for a spot in its undergraduate programs, making it crucial to understand the key admissions statistics that define the landscape of competition. From acceptance rates to test scores and yield, gaining insight into these numbers helps applicants know where they stand in the process.
📊 Acceptance Rate: Extremely Selective
Columbia’s undergraduate acceptance rate consistently places it among the most competitive universities in the United States. Recent admissions reporting shows that for the Class of 2029, the university received 59,616 applications and admitted just 2,946 students, resulting in an overall acceptance rate of approximately ~4.9%.
Historical trends also reflect how competitive Columbia has become over the years. For example:
- Class of 2028 acceptance rate: around 3.85% with over 60,000 applications.
- Class of 2027 acceptance rate: 3.9% from 57,129 applicants.
These figures underline how difficult admission is — with fewer than 5 out of every 100 applicants receiving an offer — even as the applicant pool grows year after year.
🎓 Academic Profile of Admitted Students
Academics play a central role in Columbia’s holistic admissions review, and the academic statistics of admitted students reflect extraordinary achievement:
SAT & ACT Scores
Although Columbia operates a test-optional policy, many admitted students still submit scores that demonstrate exceptional performance:
| Measure | Middle 50% Range |
|---|---|
| SAT Composite (Columbia College & Engineering) | 1510–1560 |
| ACT Composite | 34–36 |
This demonstrates that when students do choose to submit scores, they are often among the highest in the country.
High School Achievement
Columbia places significant weight on academic performance in high school. For recent admitted classes:
- Over 94–95% of enrolled students were in the top 10% of their graduating class.
- Strong GPAs — typically near or above a weighted 4.0+ — are commonplace among admitted applicants.
Given these academic profiles, it’s clear that exceptional grades and challenging coursework (e.g., AP or IB classes) are baseline expectations — and often a necessity — for competitive applicants.
📈 Yield Rate: Offers vs. Enrollments
The “yield rate” measures the percentage of students who choose to enroll after being offered admission. Columbia’s yield has consistently hovered around the mid-60% range over recent years, indicating that a significant majority of admitted students decide to attend.
This relatively high yield reflects Columbia’s prestige and the attractiveness of its academic environment, especially considering the wide range of elite institutions students might also consider.

🌍 Diversity and Student Body Composition
Columbia prides itself on offering a globally diverse student experience. Undergraduate students represent all 50 U.S. states as well as numerous countries around the world, fostering an inclusive academic community.
In addition to geographic diversity, Columbia’s student bodies include significant representation from various socioeconomic, cultural, and academic backgrounds — a reflection of the holistic review process that assesses the full spectrum of an applicant’s profile beyond numbers alone.
📌 What These Statistics Mean for Applicants
Understanding Columbia University admissions statistics helps future applicants realistically assess how competitive the process is and what criteria matter most:
- Academic Excellence Is Critical: Exceptional grades and class rank remain the backbone of a competitive profile.
- Standardized Tests Still Inform Decisions: Though test scores are optional, strong SAT/ACT results can help demonstrate academic readiness.
- Holistic Review Dominates: Columbia considers essays, recommendations, extracurriculars, and personal context alongside statistics.
For students aiming to apply, a focus on academic performance, purposeful engagement in extracurriculars, and a compelling narrative are all essential pieces of the puzzle.
🔗 Related Resources
Explore more useful guides and tools to help you navigate college admissions:
- Columbia University MBA Admissions Statistics – Competitive graduate program trends and insights.
- Columbia University General Studies Admissions – Useful if you’re exploring non-traditional undergraduate pathways.
- Columbia University Admission Criteria – What the admissions committee looks for beyond numbers.

📌 Final Thoughts
The “Columbia University admissions statistics” paint a picture of a highly selective institution where academic excellence meets holistic review. While acceptance rates remain low, the thorough review process rewards students who demonstrate outstanding achievement, meaningful engagement, and authentic personal stories. Prospective applicants benefit most when they build balanced profiles that align strength in statistics with powerful narratives and fit with Columbia’s values.
Armed with an understanding of these admissions statistics, you’re better prepared to tailor your application strategy and set realistic goals as you pursue entry into one of the world’s most prestigious universities.